Understanding & estimating your BigQuery costs easily
Learn how to efficiently manage your BigQuery costs by understanding the pricing model and implementing optimization strategies. Discover key practices like query optimization, data partitioning, and clustering to reduce expenses and enhance performance.

Introduction
Google BigQuery is a powerful cloud data warehouse that helps businesses store, process, and analyze massive amounts of data quickly and efficiently. However, understanding and managing the costs associated with BigQuery is crucial. Costs can escalate quickly if not monitored, impacting your budget and the platform’s performance. This article will help you understand the BigQuery pricing model and provide tips on effectively managing BigQuery’s costs and your cloud spending.
Early days of GCP
Initially, customers had limited tools to analyze BigQuery costs. Exporting job logs to BigQuery and analyzing them was time-consuming and required significant effort in setting up custom IAM roles, log sinks, and SQL queries.
Understanding what drives Google BigQuery costs?
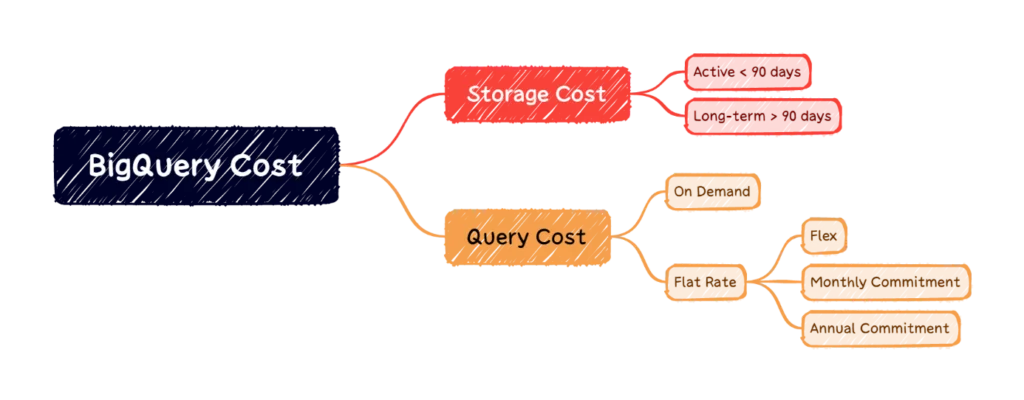
The main cost factor in Google BigQuery is the amount of data you read. If you read more data than necessary, for example, by using “SELECT *” in your queries, you’ll end up paying more. BigQuery’s pricing model is based on three key components: Storage Data, Long Term Storage Data, and Query Data Usage. Let’s break these down:
- Storage Data: BigQuery charges you based on the data you store. Data stored in the “active storage” tier (readily available for querying) is charged at $0.02 per GB per month. If the data hasn’t been accessed for over 90 days, it moves to “long-term storage” and is charged at a lower rate of $0.01 per GB per month. You can easily check the table sizes in your BigQuery dataset to estimate your storage costs.
- Long Term Storage Data:
Data that hasn’t been updated for 90 days qualifies as long-term storage, reducing costs by 50%. This means the cost drops from $0.02 per GB to $0.01 per GB per month. If you update the data, it reverts to the normal storage rate, and the 90-day count resets. Importantly, simply querying or exporting data does not count as updating, so the data retains its long-term storage status. For instance, if 25% of your data remains static and only gets queried, you can reduce your storage cost estimate from $10,000 to $8,750 monthly, saving $1,250 due to long-term storage pricing.
- Query Data Usage: To estimate query costs, you need to consider:
- Number of users per day
- Number of queries each user runs per day
- Average data usage per query
We can then take those parameters and apply a basic calculation to estimate our monthly Query Data Usage:
For example, if you have 150 users running 50 queries per day with each query using 5 GB of data, you can calculate your monthly query data usage like this:
150 users * 50 queries * 5 GB * 30 days = 1,125,000 GB (or 1,125 TB) per month.
At $5 per TB, this usage would cost about $5,625 per month. Adding storage costs, your total monthly expense could be around $14,375.
Effective cost estimation practices
Discover key practices to optimize your data operations and reduce costs with efficient queries and infrastructure management.
- Optimize Queries and Use Partitioning: Efficient queries reduce the amount of data processed, lowering your costs. Use appropriate filters, aggregates, and query optimizations. Avoid “SELECT *” and read only the necessary columns. Utilize partition filters to minimize resource usage further. Partitioning your data based on time, geography, or other relevant factors can significantly reduce query costs by limiting the amount of data scanned.
- Clustering Data: Implement clustering keys to minimize the data scanned during queries. Clustering organizes data to improve query performance, helping you save on processing costs.
- Regularly Review: Monitor data infrastructure bottlenecks and understand pipeline failures and their business impact. Use available tools and dashboards to analyze costs and identify optimization opportunities.
- Sign up for Telmai’s Free Data Quality Health Assessment:
Gain crucial insights into your key business tables and attributes to elevate data quality across your data lake and warehouse. Our no-cost, comprehensive report provides a detailed analysis of vital Data Quality KPIs, including completeness, freshness, uniqueness, and anomaly detection.
Discover data infrastructure bottlenecks, understand pipeline failures and their business impact, and receive strategic recommendations for improving data quality and managing infrastructure costs effectively. Take advantage of Telmai’s expert analysis today to optimize your data operations.
Ensure your data pipelines are efficient and cost-effective with Telmai’s expert analysis. Click here to get your Data Health Analysis today at no cost.
Passionate about data quality? Get expert insights and guides delivered straight to your inbox – click here to subscribe to our newsletter now.
- On this page
See what’s possible with Telmai
Request a demo to see the full power of Telmai’s data observability tool for yourself.