Ensuring data completeness: building trust in your data
Struggling with incomplete data? Our guide walks you through identifying critical data fields, assessing current data states, and defining thresholds. Plus, how to automate all this.

Similar to a guest who forgets to bring their share to a potluck, incomplete data can leave everyone dissatisfied and scrambling to fill the gaps. One of the most basic but crucial indicators of data quality that impacts various business operations is data completeness. Unfortunately, its effects often go undetected—until it’s too late.
Let’s take a large enterprise where different departments rely on data for their operations. The finance department, relying on transaction data for accurate financial reporting, faces challenges when incomplete records lead to discrepancies in financial statements.Incomplete data can also cripple strategic decision-making, preventing executive teams from making timely and informed decisions, potentially leading to costly errors.
In this step-by-step guide, we’ll explain the essential techniques and tools for measuring and improving the completeness of your data, ensuring you have all the information you need to make informed decisions.
What is data completeness?
Data completeness is one of the fundamental dimensions of data quality along with freshness and uniqueness. It refers to the extent to which all required data is present within a dataset.
This involves two key aspects:
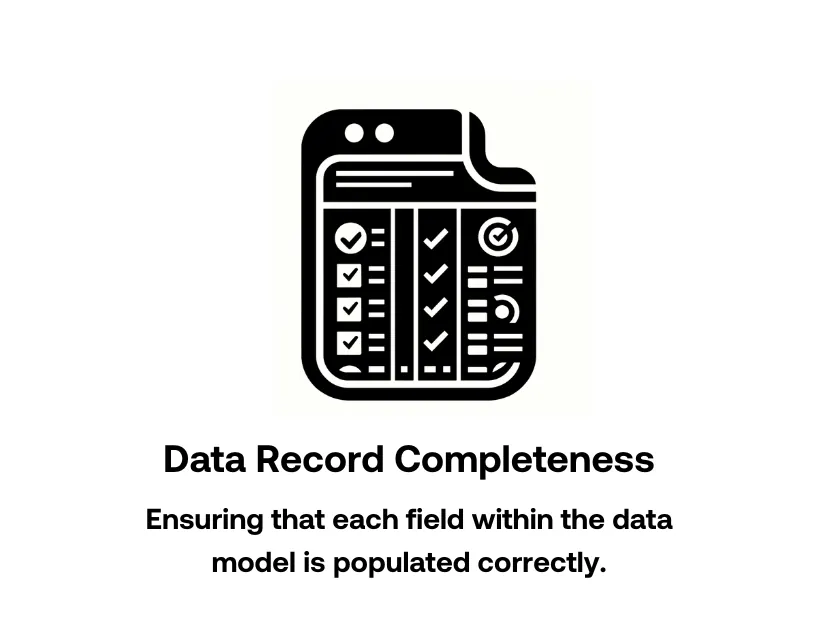
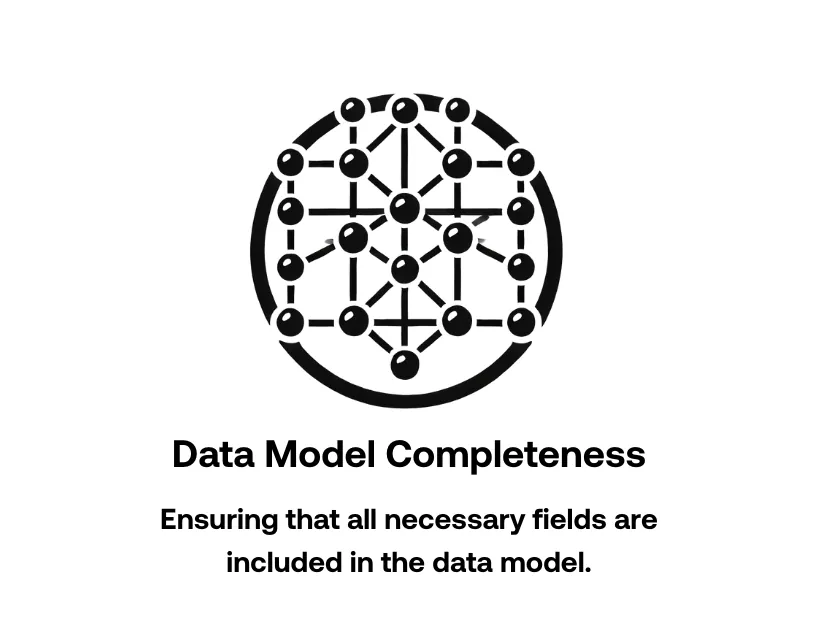
Consider the finance department of a business that relies on transaction data for accurate financial reporting. If the data model lacks essential fields like transaction date, amount, or account, it undermines data model completeness. Additionally, if any of these fields contain incomplete or placeholder values like ‘N/A’ or ‘000-000-000’, it impacts data record completeness, leading to discrepancies in financial statements.
Consider a Customer table of 3M customers has 2.94M populated emails, then the completeness of emails is:
Completeness = Number of Complete Records Total Number of Records × 100
Completeness = 2.94 Million Records 3 Million Records × 100 = 98%
Best approaches to ensure data completeness
1. Identify business-critical fields and processes
Focus on fields essential to your business processes. Consult with your various stakeholders, including data users and business process owners, to understand their requirements and the impact of each data field on their operations. For instance, in financial reporting, missing data in key fields like transaction amounts or dates can lead to significant inaccuracies affecting both business decisions and compliance.
2. Assess the current state
This is where you count up the null values and the null proxies. A null value check in SQL can be performed by using the IS NULL operator in a WHERE clause. Here’s an example:
SELECT

  [column1], [column2], ..., [columnN]

FROM

WHERE [columnX] ISNULL;

To find null proxies, you need to extend your SQL query to include conditions that check for values like -1, 9999, "N/A", "Unknown", and empty strings.

SELECT

  [column1], [column2], ..., [columnN]

FROM

  [your_table_name]

WHERE

  [columnX] IS NULL OR

  [columnX] = -1 OR

  [columnX] = 9999 OR

  [columnX] = 'N/A' OR

  [columnX] = 'Unknown' OR

  [columnX] = '';
Even better, you can automate this using data profiling tools or even built-in features of database management systems.
Once they’re all identified, you’ve established a baseline for data completeness, which helps measure progress.
3. Define acceptable thresholds for completeness
Now, the question is, what are the minimum levels of completeness required for your data to be considered valid and useful for analysis and decision-making? For example, in a customer relationship management (CRM) system, you might set a threshold that requires at least 98% of customer records to have complete contact information.
Review historical data and base this number on your business requirements. Different projects may have varying tolerance levels for incomplete data. For example, a healthcare dataset may require near-perfect completeness due to the critical nature of the information, whereas a marketing dataset may tolerate slightly higher levels of missing data.
4. Continuously monitor completeness
Add checking for data completeness and assessing the resulting % against your thresholds to your data quality monitoring process.While profiling tools can help, leveraging a comprehensive data observability platform like Telmai can take your data quality efforts to the next level.
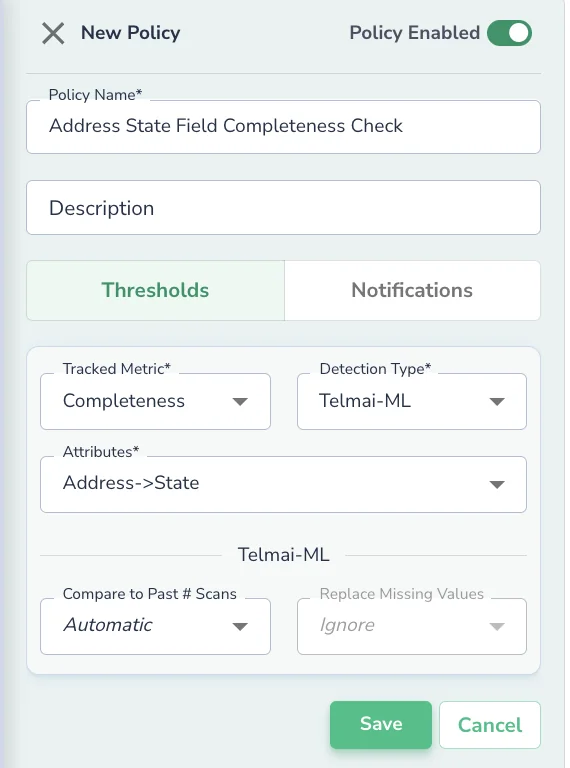
Telmai ensures data completeness by continuously monitoring and validating your data against predefined thresholds and offers a wide range of capabilities to enhance your data quality strategy.
Its user-friendly UI allows you to define what correct data should look like, and its machine-learning algorithms proactively monitor the data and alert you to deviations you may not have encountered. Ready to take your data quality to the next level? Try Telmai today.
Passionate about data quality? Get expert insights and guides delivered straight to your inbox – click here to subscribe to our newsletter now.
- On this page
See what’s possible with Telmai
Request a demo to see the full power of Telmai’s data observability tool for yourself.